"RELATIONS and FUNCTIONS"

Rectangular Coordinate System
Objectives
- describe and illustrate the Rectangular Coordinate System and its uses
- describe and plot positions on the coordinate plane using the coordinate axes
Rectangular Coordinate System is introduced using the concept of sets. You have learned the binary operations of sets: union and intersection. Recall that A ∪ B and A ∩ B are defined as follows:
A ∪ B = {x│x ∈ A or x ∈ B} A ∩ B = {x│x ∈ A and x ∈ B}
The rectangular coordinate system is also known as the Cartesian coordinate
system after
Rene Descartes, who popularized its use in analytic geometry. The rectangular
coordinate system is based on a grid, and every point on the plane can be
identified by unique x and y coordinates,
just as any point on the Earth can be identified by giving its latitude and
longitude.
The left-right (horizontal)
direction is commonly called X.
The up-down (vertical) direction is commonly called Y.
Example:
Point (6,4) is
Example:
Point (6,4) is
6 units across (in the x direction), and
4 units up (in the y direction)
Quadrants
The axes naturally divide the plane
up into quarters. We call these quadrants, and
number them from one to four. Notice that the numbering begins in the upper
right quadrant and continues around in the counter-clockwise direction. Notice
also that each quadrant can be identified by the unique combination of positive
and negative signs for the coordinates of a point in that quadrant.
You may watch the following video to strengthen your knowledge regarding the Rectangular Coordinate System. Just click the link below.
http://youtu.be/PjzPoxSZ-lY
To enhance your knowledge, try to answer the following:


You may watch this video regarding relations and functions. Just click the link below.
http://youtu.be/H9ZG9F3eW_w
To enhance your knowledge, try to answer the following:
1. What is the domain and range of the following relation?
LESSON 3:
Objectives

Look at the graph below:

Let’s summarize. You have learned that
Quadrant I x > 0, or x is positive y > 0, or y is positive or (+, +);
Quadrant II x < 0, or x is negative y > 0, or y is positive or (–, +);
Quadrant III x < 0, or x is negative y < 0, or y is negative or (–, –);
Quadrant IV x > 0, or x is positive y < 0, or y is negative or (+, –).
LESSON 1:
What is a Mathematical Expression?
In mathematics, any meaningful combination of constants, operators, and variables representing numbers or quantities. It shows mathematical relationships. It has no solution and does not have an answer but can be evaluated.


•If the sign is > or < the line is dashed


Using what you knew, try to answer the following.

http://youtu.be/PjzPoxSZ-lY
To enhance your knowledge, try to answer the following:
Complete each statement.
1. Draw a small Cartesian plane and label the following on it.
1. Draw a small Cartesian plane and label the following on it.
a. X-axis
and y-axis
b. The
four quadrants
c. The
origin
2. Draw and label the axis of a Cartesian plane on the following grid. Then plot and label the following points on the plane.
2. Draw and label the axis of a Cartesian plane on the following grid. Then plot and label the following points on the plane.
a. (2,1)
b. (2,-2)
c. (0,4)
d. (-4,-3)
3. Draw and label the axis of the Cartesian plane of the following grid. Rectangle PQRS has the following vertices. P (-2,2), Q (6,-2), R (4,-6), S (?,?).
3. Draw and label the axis of the Cartesian plane of the following grid. Rectangle PQRS has the following vertices. P (-2,2), Q (6,-2), R (4,-6), S (?,?).
a. Plot
and label the rectangle.
b. Find
the coordinate for S.
4. State which quadrant the following are in.
4. State which quadrant the following are in.
a. (4,5)
_____________
b. (-6,2)____________
c. (1,-5)____________
d. (-6,-1)____________
5. Plot and label the points. Connect them in order. What polygon is formed?
T (-4,1), N (-3,-3), P (5,-1), Q (4,3), T (-4,1)
5. Plot and label the points. Connect them in order. What polygon is formed?
T (-4,1), N (-3,-3), P (5,-1), Q (4,3), T (-4,1)
LESSON 2:
Representation of Relations and
Functions
Objectives
- define and illustrate relation and function
- determine if a given relation is a function using ordered pairs, graphs, and equations
- differentiate dependent and independent variables
- describe the domain and range of a function
A relation is simply a set of ordered pairs.
The first elements in the ordered pairs (the x-values),
form the domain.
The second elements in the ordered pairs (the y-values),
form the range.
Only the elements "used" by the relation constitute the range.
The
mapping below shows a relation from set A into set B. This relation consists of the ordered pairs (1,2), (3,2), (5,7), and (9,8).
•The domain is the set {1, 3, 5, 9}.
•The domain is the independent variable.
•The range is the set {2, 7, 8}. (Notice that 3, 5
and 6 are not part of the range.)
•The range is the dependent variable.
The following are examples of
relations. Notice that a vertical line may intersect a relation in more
than one location.
This set of 5 points is a relation. This parabola is also a relation.
Notice that a vertical line can
intersect this graph twice.
{(1,2), (2, 4), (3, 5), (2, 6), (1, -3)}
Notice that vertical lines may intersect
more than one point at a time.
Notice that a vertical line can
intersect this graph twice.
{(1,2), (2, 4), (3, 5), (2, 6), (1, -3)}
Notice that vertical lines may intersect
more than one point at a time.
Examples
Each vertical
line drawn through the graph will intersect a function
in only one location
You may watch this video regarding relations and functions. Just click the link below.
http://youtu.be/H9ZG9F3eW_w
To enhance your knowledge, try to answer the following:
1. What is the domain and range of the following relation?
{
(-1, 2), (2, 51), (1, 3), (8, 22), (9, 51) }
domain:_____________
range:______________
2. What is the domain and range of the following relation?
2. What is the domain and range of the following relation?
{
(-5, 6), (21, -51), (11, 93), (81, 202), (19, 51) }
domain:____________
range:_____________
3. Which relation below are functions? ________________
3. Which relation below are functions? ________________
Relation #1{ (-1, 2),
(-4, 51), (1, 2), (8, -51) }
Relation #2 { (13,
14), (13, 5), (16, 7), (18, 13) }
Relation #3 { (3, 90), (4,
54), (6, 71), (8, 90) }
4. Which
relation below are functions? ________________
Why?
Relation #1 { (3, 4), (4, 5), (6,
7), (8, 9) }
Relation #2 { (3, 4), (4, 5), (6,
7), (3, 9) }
Relation #3 { (-3, 4), (4, -5), (0,
0), (8, 9) }
Relation #4 {(8,11), (34, 5), (6,
17), (8, 19) }
5. For
the following relation to be a function, X
cannot be what values?
{ (8, 11), (34, 5), (6, 17),
(X, 22) }
6. For
the following relation to be a function, X
cannot be what values?
{ (12, 13), (-11,
22), (33, 101), (X, 22)
LESSON 3:
Linear Function and Is Application
Objectives
- define linear function
- describe a linear function using its points, equation, and graph
- identify the domain and range of a linear function
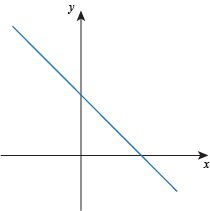
Linear function is a function whose graph is a straight
line. The line can't be vertical, since then we wouldn't have a function, but
any other sort of straight line is fine.
Positive Slope Negative Slope
A linear function can be described by a linear
equation. A
linear equation is a degree
polynomial. In
other words, each term in a linear equation is either a constant or the product
of a constant and a single variable.
Illustrative Example 1
Is the function f
defined
by f(x) = 2x
+ 3 a
linear function? If yes, determine the slope m and the y-intercept b.
Solution:
Yes, the function f
defined
by f(x) = 2x
+ 3
is a linear function since the highest exponent (degree) of x
is
one and it is written in the form f(x) = mx + b. The slope m
is 2
while the y-intercept
b
is 3.
Illustrative Example 2
Is the function g
defined
by g(x) = -x
a
linear function? If yes, determine its slope and y-intercept.
Solution:
Yes, the function g
is a
linear function because it has a degree one. Since g(x) = -x
can
be written as g(x) = -1x +
0, its
slope is -1 and y-intercept is 0.
Illustrative Example 3
Determine the values of the function f
if f(x) = 2x
– 1
at x
= -3,
0, and 2. Give their meanings and ordered pairs.
Solution:
If x = -3, then f(x) = 2x – 1 becomes
f(-3) = 2(-3) – 1
f(-3) = -6 – 1
f(-3) = -7, which means the value of f
at x
= -3
is -7.
Or, if x = -3, then y = -7. This gives the ordered pair (-3,
-7). Recall that an ordered pair can be written (x, y).
If x = 0, then f(x) = 2x – 1 becomes
f(0) = 2(0) – 1
f(0) = 0 – 1
f(0) = -1, which means the value of f
at x
= 0
is -1.
Or, if x = 0, then y = -1. This gives another ordered pair (0,
-1).
If x = 2, then f(x) = 2x – 1 becomes
f(2) = 2(2) – 1
f(2) = 4 – 1
f(2) = 3, which means the value of f
at x
= 2
is 3.
Or,
if x
= 2,
then y
= 3.
This gives the ordered pair (2, 3). Look at the graph below:
This implies that the graph of the
function f
will
pass through the points (-3, -7), (0, -1) and (2, 3). Out of the values, we can
have the table below:
x -3 0 2
f(x) -7 -1 3
You may watch the video regarding the linear function and its application. Just click the link below.
Generalization/Summary
Let’s summarize. You have learned that
- The Cartesian plane is composed of two perpendicular number lines that meet at the point of origin (0, 0) and divide the plane into four regions called quadrants.
- Let ℜ be the set of real numbers. The notation ℜ2 is the set of ordered pairs (x, y), where x and y∈ℜ. In symbols, ℜ2 = ℜ × ℜ = {(x, y)|x∈ℜ, y∈ℜ.}.
- The signs of the first and second coordinates of a point vary in the four quadrants as indicated below.
Quadrant I x > 0, or x is positive y > 0, or y is positive or (+, +);
Quadrant II x < 0, or x is negative y > 0, or y is positive or (–, +);
Quadrant III x < 0, or x is negative y < 0, or y is negative or (–, –);
Quadrant IV x > 0, or x is positive y < 0, or y is negative or (+, –).
- The points which lie in the x-axis have coordinates (x, 0) and the points which lie in the y-axis have coordinates (0, y), where x and y ∈ ℜ
- A relation is any set of ordered pairs.
- The set of all first coordinates is called the domain of the relation while the set of all second coordinates is called the range.
- A function is a special type of relation. It is a relation in which every element in the domain is mapped to exactly one element in the range.
- A correspondence may be classified as one-to-one, many-to-one, or one-to-many. It is one-to-one if every element in the domain is mapped to a unique element in the range, many-to-one if any two or more elements of the domain are mapped to the same element in the range, and one-to-many if each element in the domain is mapped to any two or more elements in the range.
- A set of ordered pairs is a function if no two ordered pairs in the set have equal abscissas.
- If every vertical line intersects the graph no more than once, the graph represents a function by the Vertical Line Test.
- The function described by a horizontal line drawn on a Cartesian plane is a Constant function.
- A vertical line does not represent a function.
- The dependent variable depends on the value of independent variable. One is free to assign values for the independent variable, which controls the value of the dependent variable.
- f(x), read as “f of x,” is used to denote the value of the function f at the given value of x.
- The domain of the function f is the set of all permissible values of x that will make the values of f real numbers.
- A Linear Function is defined by f(x) = mx + b, where m is the slope and b is the y-intercept, m and b∈ℜ and m ≠ 0. It is of first degree and its graph is a line.
- The domain of the linear function f is the set of all real numbers. Similarly, its range is the set of real numbers. In symbols, Df = {x|x∈ℜ} and Rf = {y|y∈ℜ}.
- A linear function may be described using its points, equation, and graph
- A linear equation is an equation in two variables which can be written in two forms:
- Standard form: Ax + By = C, where A, B and C∈ℜ, A ≠ 0 and B ≠ 0; and
- Slope-intercept form: y = mx + b, where m is the slope and b is the y-intercept, where m and b ∈ℜ, and m ≠ 0.
- The slope of a line refers to its steepness. It can be solved by using:
- m = riserun if the graph is given.
- m = y2 – y1x2 – x1 if two points are given.
- The slope of a line other than vertical line is constant.
- The slope of the horizontal line is zero while that of the vertical line is undefined.
- The sign of the slope tells the trend of the graph.
- If the slope m is positive, then the line rises to the right.
- If the slope m is negative, then the line falls to the right.
- If m is zero, then the graph is a horizontal line.
- If m is undefined, then the graph is a vertical line.
- Linear equations can be graphed in four ways:
- using two points
- using x- and y-intercepts
- using the slope and the y-intercept
- using the slope and a point
- Linear functions can be solved in three ways:
- using slope-intercept form
- using point-slope form
- using two-point for
- Problems involving constant rate of change can be solved using linear functions.
Glossary of Terms used in the Lesson
- Cartesian plane- Also known as the Rectangular Coordinate System which is composed of two perpendicular number lines (vertical and horizontal) that meet at the point of origin (0, 0).
- Degree of a function f- The highest exponent of x that occurs in the function f.
- Dependent variable- The variable (usually) y that depends on the value of the independent variable (usually) x.
- Domain of the relation- The set of first coordinates of the ordered pairs.
- Function- A relation in which each element in the domain is mapped to exactly one element in the range.
- Function notation- A notation in which a function is written in the form f(x) in terms of x.
- Horizontal line- A line parallel to the x-axis.
- Independent variable- The variable (usually) x that controls the value of the dependent variable (usually) y.
- Line- A straight line in Euclidean Geometry.
- Linear Function- A function of first degree in the form f(x) = mx + b, where m is the slope and b is the y-intercept.
- Mapping diagram- A representation of a relation in which every element in the domain corresponds one or more elements in the range.
- Mathematical phrase- An algebraic expression that combines numbers and/or variables using mathematical operators.
- Ordered pair- A representation of point in the form (x, y).
- Point-slope form- The linear equation y − y1 = m(x − x1) is the point-slope form, where m is the slope and x1 and y1 are coordinates of the fixed point.
- Quadrants- The four regions of the xy-plane separated by the x- and y-axes.
- Range of the relation- The set of second coordinates of the ordered pairs.
- Rate of change- The slope m of the line and is the quotient of change in y-coordinate and the change in x-coordinate.
- Rectangular Coordinate System- Also known as Cartesian plane or xy-plane
- Relation- Any set of ordered pairs.
- Slope of a line- Refers to the steepness of a line which can be solved using the formulae: m = riserun or m = y2 − y1x2 − x1.
- Slope-intercept form The linear equation y = mx + b is in slope-intercept form, where m is the slope and b is the y-intercept.
- Standard form- The linear equation in the form Ax + By = C, where A, B and C are real numbers.
- Trend- Tells whether the line is increasing or decreasing and can be determined using the value of m (or slope).
- Two-point form- The linear equation y − y1 = y2 − y1x2 − x1 (x − x1) is the two-point form, where x1 and y1 are coordinates of the first point while x2 and y2 are coordinates of the second point.
- Vertical line- A line parallel to the y-axis.
- Vertical Line Test- If every vertical line intersects the graph no more than once, the graph represents a function.
- x-axis- The horizontal axis of the Cartesian plane.
- x-intercept- The x-coordinate of the point at which the graph intersects the x-axis.
- y-axis- The vertical axis of the Cartesian plane.
- y-intercept- The y-coordinate of the point a
"LINEAR INEQUALITIES in TWO VARIABLES"
LESSON 1:
Graphing
Linear Inequalities in Two Variables
What is a Mathematical Expression?
In mathematics, any meaningful combination of constants, operators, and variables representing numbers or quantities. It shows mathematical relationships. It has no solution and does not have an answer but can be evaluated.
Examples
of Expressions
- 5 + x
- 7x+23
- 3 – 15y
- 12x + 10y + 3
To
Evaluate An Expression:
step 1: substitute
values for the variables.
step 2:The
evaluation changes if you
step 3: substitute
different numbers in for the variables.
step 4: In
this way, expressions can be simplified.
Example:
5x
+ 6
If
x = 5, then
5x + 6
5 (5) + 6
25 + 6
31
What
is a Mathematical Equation?
Mathematical equation is a
statement of an equality between two expressions, used in almost all branches
of pure and applied mathematics and in the physical, biological, and social
sciences. An equation usually involves one or more unknown quantities, called
variables. It is named for the number of variables it contains, called an equation
in one, two, three, or more variables.
Equations
(Cont.)
- Equates two expression.
- Can be solved.
- There will be a single solution to an equation.
Examples
of Equations
- 2x + 5 = 13
- (x + y)2 = x2 + 2xy + y2
- x2 - 2x = 3
- 3x2 + 4y = 28
Example:
- The equation 4y + 6 = 18 has one solution.
- Process to solve involves “isolating the variable”.
4y + 6 = 18
4y +6 – 6 =
18 – 6 (Subtraction Property of Equality)
4y = 12 (Division
Property of Equality)
4 4
y = 3
- This means that only one value, 3, allows the two expressions have the same value.
LESSON 2:
EQUATIONS and INEQUALITIES in TWO
VARIABLES
Objectives
- differentiate between mathematical equations and inequalities
- illustrate linear inequalities in two variables
Graphing Linear
Equations in Two Variables
In
the rectangular coordinate system, the horizontal number line is the
x-axis.The
vertical number line is the y-axis. The point of intersection of these axes
is their zero points, called the origin. The axes divide the plane into 4
quarters, called quadrants.
Each
point in the rectangular coordinate system corresponds to an ordered pair of real numbers (x,y).
Note the word “ordered” because order
matters. The first number in each pair, called
the x-coordinate, denotes the distance and direction from
the origin along the x-axis. The second number, the y-coordinate, denotes vertical distance and direction
along a line parallel to the y-axis or along the y-axis itself.
In
plotting points, we
move across first (either left or right), and then
move either up or down,
always
starting from the origin.
Example
Plot
the point (-3,2).
The Graph of an Equation
The
graph of an equation in two variables is the set of points whose coordinates satisfy the equation.
An ordered pair of real numbers (x,y) is
said to satisfy the equation when substitution of the x and y coordinates into
the equation makes it a true statement.
For
example, in the equation:
y
= 2x + 6, the
ordered pair (1,8)
is a solution.
When we substitute this point the sentence reads 8 = 8, which is true.
The
ordered pair (2,3)
is not a solution.
When we substitute this point, the sentence reads 3 = 10, which is not true.
Solution of an Equation in Two
Variables
If
when the x-coordinate of the ordered pair is substituted for x and the
y-coordinate of the ordered pair is substituted for y, we obtain a true
statement- then the
ordered pair is a solution to the equation.
Example:
Given
the equation 2x + 3y = 18, determine if the ordered pair (3, 4) is a
solution to the equation.
We
substitute 3 in for x and 4 in for y.
2(3) + 3 (4) ? 18
6 + 12 ? 18
18 = 18
True
Therefore,
the ordered pair (3, 4) is a solution to the equation 2x
+ 3y = 18.
Comparison of Graphs of Linear
Equations
The
graph of y
= mx + b is
the graph of
y = mx shifted b
units up when
b
is a positive
number.
The
graph of y
= mx + b is
the graph of
y = mx
shifted b
units down when
b
is a negative number.
You may watch the video regarding the equations and inequalities in two variables. Just click the link below.
https://www.youtube.com/watch?v=L5QmET7bSH4
https://www.youtube.com/watch?v=L5QmET7bSH4
Try to answer the activity below.
Show the graph of each of the following linear equations in a Cartesian
coordinate plane.
1. y = x + 4
2. y = 3x – 1
3. 2x + y = 9
4. 10 – y = 4x
5. y = -4x + 9
LESSON 3:
GRAPHING LINEAR INEQUALITY in TWO
VARIABLES
Objectives
- graph linear inequalities in two variables on the coordinate plane
- solve real-life problems involving linear inequalities in two variables
Graphing Linear Inequalities
The graph of a linear inequality in two variables is the graph of all solutions of the inequality.
The boundary line of the inequality divides the coordinate plane into two half-planes: a shaded region which contains the points that are solutions of the inequality, and an unshaded region which contains the points that are not.
The graph of a linear inequality in two variables is a half-plane. To graph a linear inequality, follow these steps.
1. Graph the boundary line of the inequality. Use a dashed line for < or > and a solid line for £ or ³.
2. To decide which side of the boundary line to shade, test a point not on the boundary line to see whether it is a solution of the inequality. Then shade the appropriate half-plane.
Some helpful hints.
•If the sign is > or < the line is dashed
•If the sign is ³ or £ the line will be solid
When dealing with just x and y.
•If the sign > or ³ the shading either goes up or to the right
•If the sign is < or £ the shading either goes down or to the left
Graphing Linear Inequalities in One Variable
Graph a) y < –2 and b) x £ 1 in a coordinate plane.
Solution
Graph the boundary line y = –2. Use a dashed line because y < – 2.
Test the point (0, 0).
Because (0, 0) is not a solution of the inequality, shade the half-plane below the line.
Graph the boundary line x = 1. Use a solid line because x £1.
Test the point (0, 0).
Because (0, 0) is a solution of the inequality, shade the half-plane to the left of the line.
You may watch the video on graphing linear inequalities in two variables. Just click the link below.
Using what you knew, try to answer the following.
Graph each linear inequality and test a point.
- y ³ 4x + 4
- y < -3x +1
- y £ 3x + 3
- . y £ x +1
Generalization/Summary
This module was about linear inequalities in two variables. In this module, you were able to differentiate between mathematical expressions and mathematical equations; differentiate between mathematical equations and inequalities; illustrate linear inequalities in two variables; graph linear inequalities in two variables on the coordinate plane; and solve real-life problems involving linear inequalities in two variables. More importantly, you were given the chance to formulate and solve real-life problems, and demonstrate your understanding of the lesson by doing some practical tasks.
Glossary of Terms Used in the Lesson
- Cartesian coordinate plane – the plane that contains the x- and y-axes
- Coordinates of a point – any point on the plane that is identified by an ordered pair of numbers denoted as (x, y)
- Geogebra – a dynamic mathematics software that can be used to visualize and understand concepts in algebra, geometry, calculus, and statistics.
- Half plane – the region that is divided when a line is graphed in the coordinate plan.
- Linear equation in two variables/mathematical equation – a mathematical statement indicating that two expressions are equal and using the symbol “=”
- Linear inequality in two variables – a mathematical statement that makes use of inequality symbols such as >, <, ≥, ≤ and ≠
- Mathematical expression – the left or the right member of any mathematical statement
- Plane divider – the line that separates the cartesian coordinate plane into two half planes
- Slope of a line – the steepness of a non-vertical line
- Solutions of linear equations – points in the coordinate plane whose ordered pairs satisfy the equality
- Solutions of linear inequalities – points in the coordinate plane whose ordered pairs satisfy the inequality
- Variables – any quantity represented by a letter of the alphabet
- x-intercept – the x-coordinate of the point where a graph intersects the x-axi